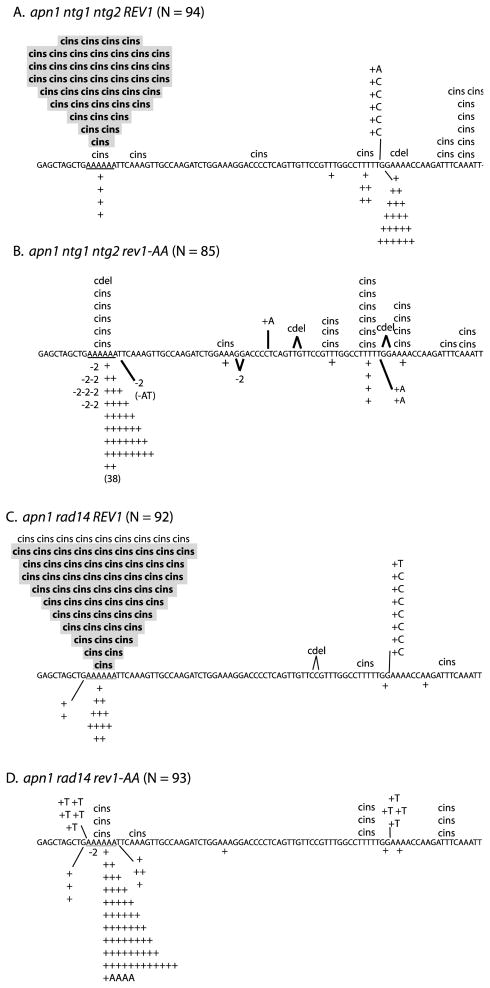
Figure 1.
Effect of rev1-AA allele on pTET-lys2ΔA746 reversion spectra. The 6A hotspot is underlined; complex insertions and simple insertions are indicated by “cins” and “+,” respectively. In A and B, cins that have an associated T > G base substitution are highlighted in gray; in C and D, cins that have an associated A > C base substitution are highlighted. When an insertion occurs outside a run, the base inserted is indicated. Only the first half of the reversion window is shown, as >95% of reversion events were in this region. N, number of revertants sequenced. The apn1 ntg1 ntg2 and apn1 rad14 spectra were published previously [25, 26]

