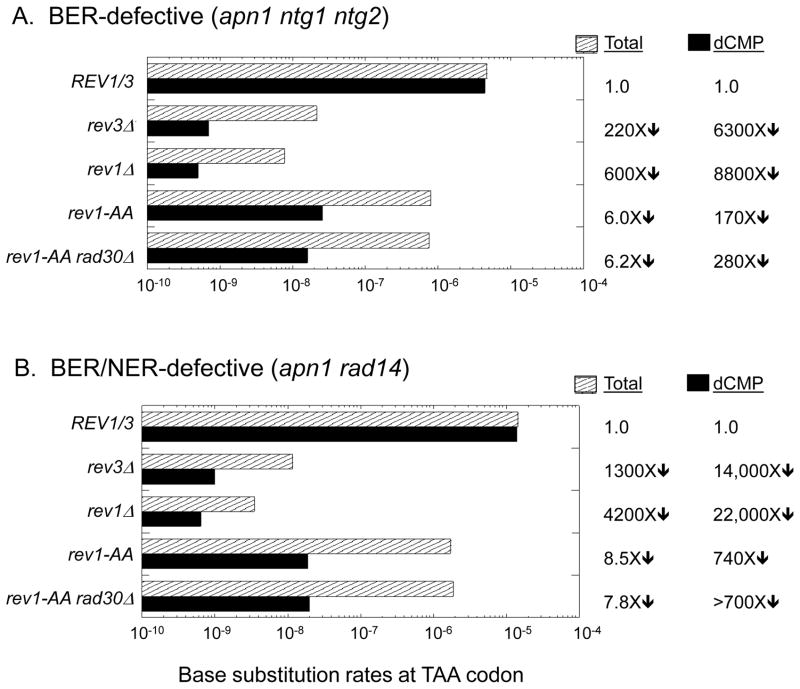
Figure 5.
Base substitution rates in the pTET-lys2-TAA reversion assay. The total Lys+ rate and the rate of dCMP insertion are indicated by striped and solid bars, respectively. Changes in these rates in TLS-polymerase mutants relative to the REV1/3 background are indicated to the right of the graphs. When none of the relevant event was observed in the corresponding spectrum, the rate was calculated assuming one event and “>” precedes the rate change. The rates and the number of mutants sequenced in each genetic background are in Table S5.

