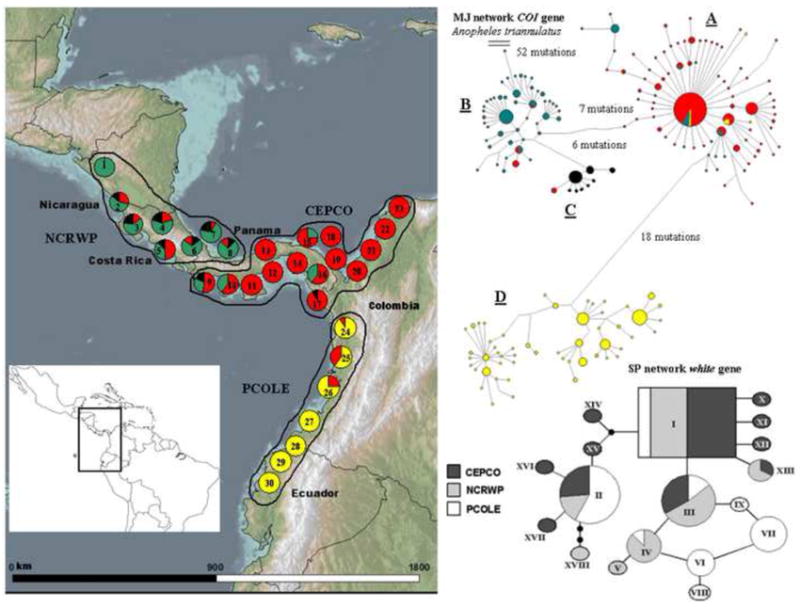
Fig. 1.

The map shows the geographic distribution of four COI haplogroups (A, red), (B, green), (C, black) and (D, yellow) from the MJ haplotype network of Anopheles albimanus, located in the upper right corner. The circled numbers correspond to 30 localities, positioned on the map according to the longitude and latitude of each site. Three population demes defined by SAMOVA are outlined: Nicaragua, Costa Rica and the Atlantic coast of western Panama (NCRWP = localities 1– 8); the Pacific coast of western Panama, central – eastern Panama and the Caribbean coast of Colombia (CEPCO = localities 9 – 23); and the Pacific coast of Colombia and Ecuador (PCOLE = localities 24 – 30). The statistical parsimony network of nine white gene alleles (I – IX) and their geographical distributions are shown in the lower right corner. The inset map depicts the geographic position of the study area.
