
Figure 2.
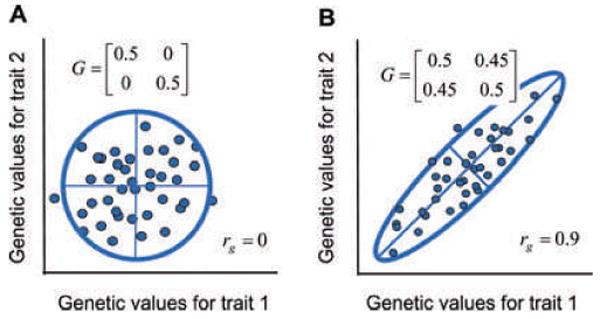
The distribution of additive genetic values for two traits can be represented as a cloud of values or a matrix, G. Same conventions as in Figure 2. (A) A data cloud with no genetic correlation (rg = 0). (B) A data cloud with a strong positive genetic correlation (rg = 0.9).