
Figure 3.
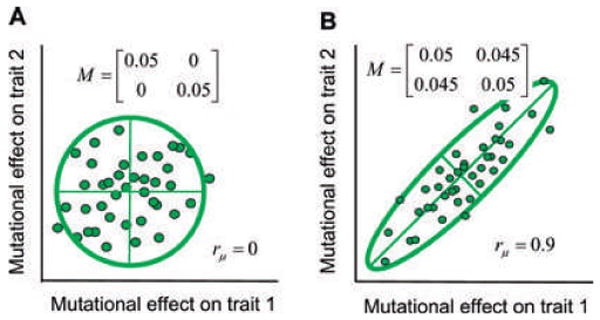
The distribution of new mutational effects on two traits from a particular locus can be represented as a cloud of values or a matrix, M. The 95% confidence ellipses for each data cloud are shown. The axes inside each ellipse are eigenvectors (principal components). (A) A cloud of mutations with no correlation (rμ = 0). (B) A cloud of mutations with a strong positive correlation in mutational effects (rμ = 0.9).