
Figure 7.
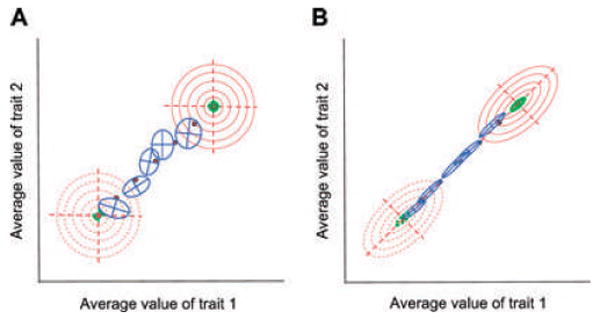
Contrasting conditions can promote instability or stability of the G-matrix on an adaptive landscape with a moving optimum. Results from simulations using the Jones et al. (2004) program are shown in this figure. In both cases the peak of the adaptive landscape (solid red dot) has moved from the bottom left to the upper right at the same rate. Peak position is shown every 300 generations. The bivariate phenotypic mean (intersection of the axes of the G-matrix, shown as a blue ellipse) tracks the moving peak and is also shown every 300 generations. Effective population size is relatively small (Ne = 342). (A) No correlated pleiotropic mutational effects (shown as a circular green ellipse, rμ = 0) and no correlational selection (shown as a circular adaptive landscape, red contours, rω = 0) promote instability of the G-matrix. Notice that G (blue ellipses) changes in size, shape, and especially in orientation from snapshot to snapshot. (B) Strong mutational correlation (rμ = 0.9) and strong correlational selection (rω = 0.9), combined with peak movement along the selective line of least resistance, promote stability in the size, shape, and orientation of the G-matrix. Notice that the cigar-shaped G-matrices hardly vary from snapshot to snapshot. Although the three stability-promoting conditions are combined here, other simulations show that they make individual contributions to the stability and evolution of the G-matrix.