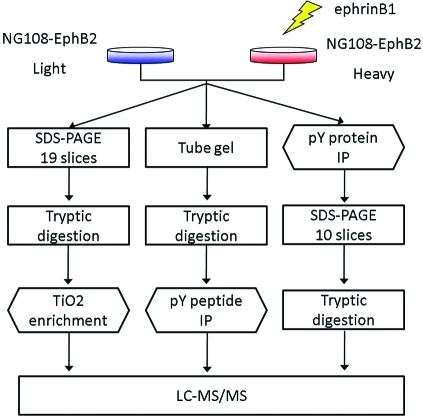
Figure 1.
Overview of the workflow for using three phosphoproteomic strategies to study EphB signaling. NG108-EphB2 cells were labeled with SILAC. The ephrinB1 ligand treated and untreated cells were combined for each of the three analyses. For each cell condition, approximately 100 million cells were used for the pY peptide/protein analysis and about 20 million for the pSTY peptide analysis. The total mass spectrometry analysis time was 95, 2.5, and 20 h for the pSTY peptide, pY peptide and pY protein analysis, respectively.

