
Figure 5.
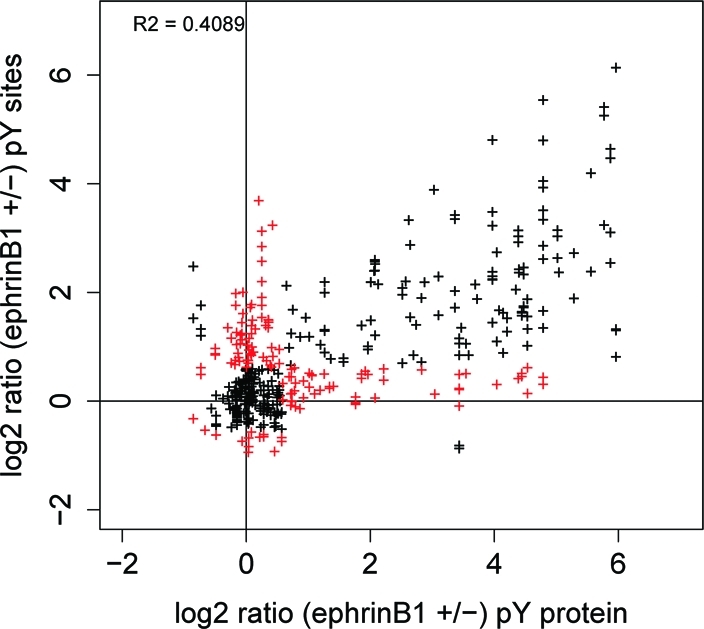
Correlation of SILAC ratios between pY proteins (from the pY protein experiment) and their pY sites (from the pY peptide experiment). Data points in red represent cases where significant SILAC ratios were observed in one experiment but not the other.