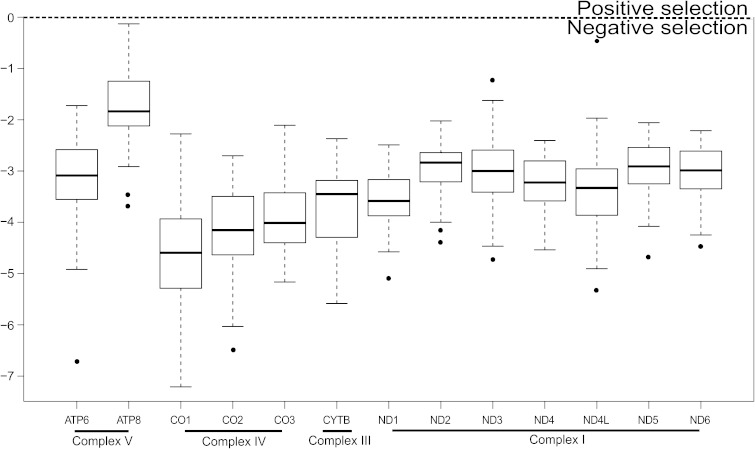
FIG. 2.—
Log ω estimates for vertebrate genome data set (see text and table 5), divided by 13 mitochondrial genes. Horizontal black lines: mean values; black points: outliers. Genes encoding for proteins of same RC complex grouped together by black horizontal lines. Horizontal dotted line: threshold by which positive or negative selection affecting sequences can be determined.

