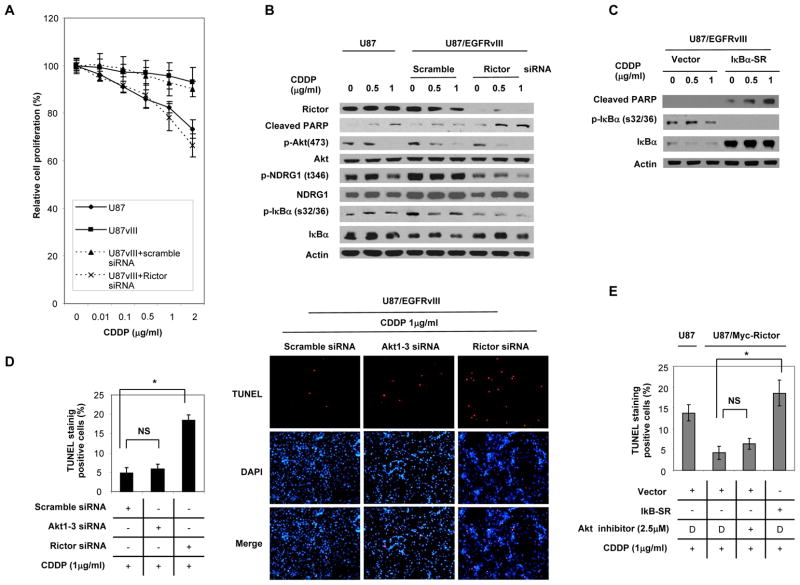
Figure 4. mTORC2 mediates EGFRvIII-dependent chemotherapy resistance through NF-κB, independent of Akt.
(A) Relative cell proliferation of U87, U87/EGFRvIII, U87/EGFRvIII+scrambled control siRNA and U87/EGFRvIII+Rictor siRNA cells with the treatment of varying amounts of cisplatin (CDDP) for 48 hours. Data represent the mean +/− SEM of three independent experiments.
(B) Immunoblot analysis using indicated antibodies of U87MG and U87/EGFRvIII transfected with siRNA against Rictor and scrambled control treated with CDDP or normal saline.
(C) Immunoblot analysis using indicated antibodies of U87/EGFRvIII infected with adenovirus encoding IκBα-SR treated with CDDP or normal saline.
(D) TUNEL staining in U87/EGFRvIII cells transfected with siRNA against Akt1-3, Rictor and scrambled control treated with CDDP (1 μg/ml) or normal saline. The percentage of apoptotic cells was calculated as the percentage of TUNEL-positive cells out of 400 cells for each group using NIH image. Data represent the mean +/− SEM of three independent experiments (Statistically significant with *p<0.01, NS; not significant). Images are magnified x100.
(E) TUNEL staining in myc-Rictor expressing U87 cells treated with Akt inhibitor (2.5 μM) or transfected adenovirus encoding IκBα-SR under CDDP treatment (1 μg/ml). D; DMSO. The percentage of apoptotic cells was calculated as the percentage of TUNEL-positive cells out of 400 cells for each group using NIH image. Data represent the mean +/− SEM of three independent experiments (Statistically significant with *p<0.01, NS; not significant).
See also Supplementary Figure S9, 10, 11 and 12.

