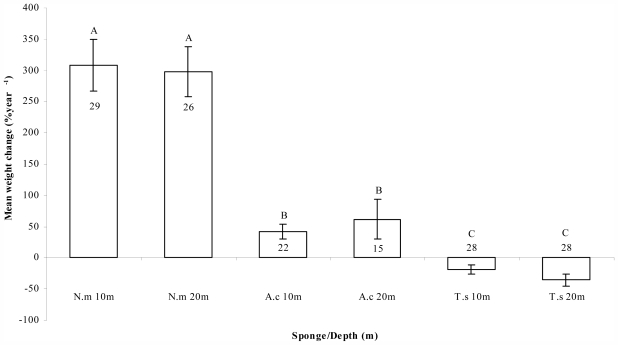
Figure 3.
Mean percentage weight change (±S.E.) per year for N. magnifica (N.m), A. chloros (A.c), and T. swinhoei (T.s), at 10 m and 20 m. Growth rate percentage for each individual was determined by comparison of final to initial weight. Number of samples is given in or above the bars. Letters above bars represent statistically significant groups.

