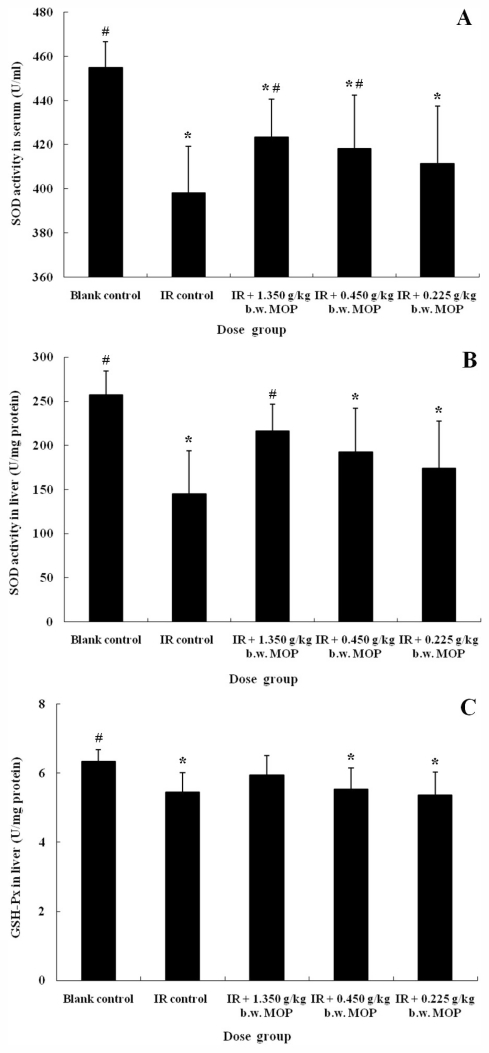
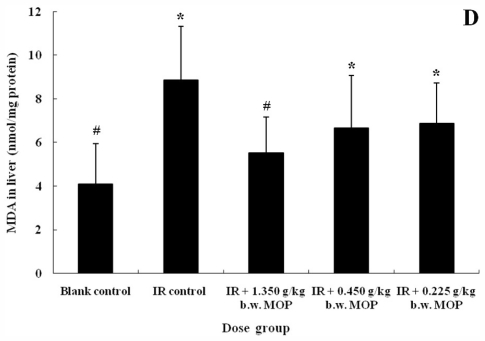
Figure 2.
Effect of MOP on SOD activity in serum (A) and liver (B), GSH-Px activity (C) and MDA level (D) in liver after WBI (4.5 Gy). Values represented the mean ± S.D. (n = 10 per group). * p < 0.05 versus blank control; # p < 0.05 versus irradiation control. MOP, marine oligopeptide preparation; SOD, superoxide dismutase; GSH-Px, glutathione peroxidase; MDA, malondialdehyde; WBI, whole-body irradiation; S.D., standard deviation; IR, irradiation; b.w., body weight.


