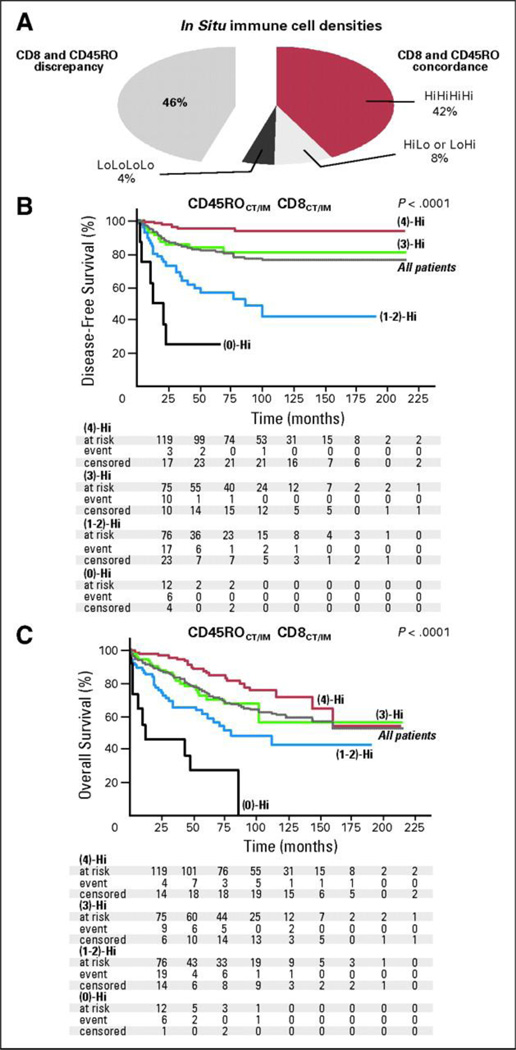
Figure 2.
(A)The pie chart illustrates the repartition of the patients according to the presence of concordance (right part) or discrepancy (left part) between CD8+ and CD45RO+ cell densities in combined tumor regions of stages I and II colorectal tumors. Fifty-four percent of the patients presented with similar high (4)-Hi, low (0)-Hi, or heterogeneous (2)-Hi immune infiltration for markers, whereas 46% presented with distinct patterns. (B, C) Kaplan-Meier curves for the duration of disease-free survival and overall survival according to a combined analysis of CD8+ and CD45RO+ densities in tumor regions (center of the tumor [CT] and invasive margin [IM]), in patients with stage I or II colorectal cancer. Patients are stratified according to an immune score ranging from 0 to 4, depending on the total number of high densities observed (two markers assessed in CT, two markers assessed in IM). For example, (4)-Hi refers to a tumor with high densities of CD8+ and CD45RO+ cells in CT and IM regions of the tumor (red line). (3)-Hi refers to tumors with three high densities (green line). (0)-Hi represents tumors with low densities of CD8+ and CD45RO+ cells in both tumor regions (black line). Patients with an immune score of 1 or 2 [(1)-Hi, (2)-Hi] experiencing similar outcome were therefore regrouped [1–2-Hi; blue line]. Log-rank statistical test, P < .001 for all comparisons. Duration of disease-free survival and overall survival of the entire cohort of patients is also represented (gray line). From Pages F, et al. In situ cytotoxic and memory T cells predict outcome in patients with early-stage colorectal cancer. J Clin Oncol 27(35), 2009:5944–51.

