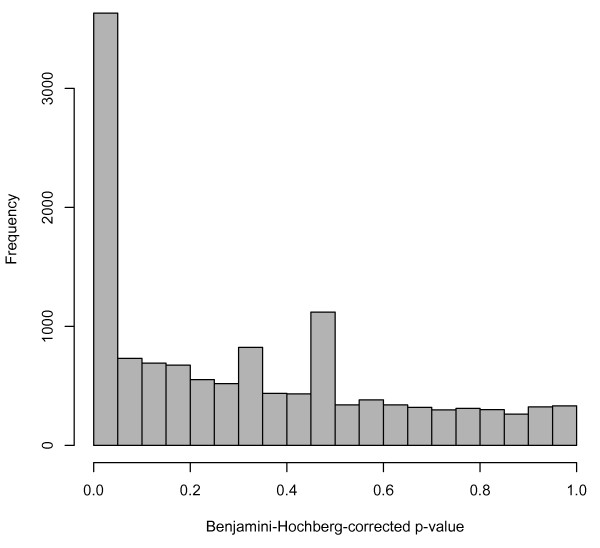
Figure 1.
Histogram of adjusted p-values from differential expression analysis on the 29 samples included in both Cheung and Montgomery. The p-values in the histogram are from paired t-tests on the 25% of genes with nonzero counts in at least one of the two studies. The peak near zero is somewhat indicative of technical variability between the two studies.

