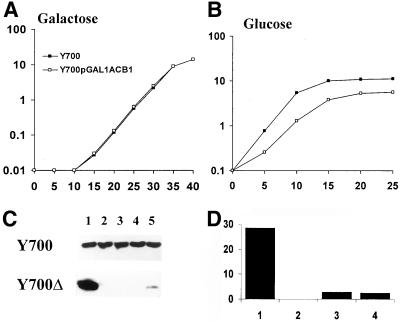
Figure 1.
Growth curves of Y700 and Y700pGAL1-ACB1 in YNB-galactose (A) and YNB-glucose (B) media. The growth was followed spectrophotometrically by measuring the cell density at 600 nm. (C) Acb1p levels in Y700 and Y700pGAL1-ACB1 in cells grown in YNB-galactose for 48 h (lane 1) and in YNB-glucose for 24 h (lane 2), diluted into fresh YNB-glucose medium to OD 0.1 and grown to OD 0.2 (lane 3) and OD 0.5 (lane 4) and for 36 h (lane 5). (D) Quantitative data obtained by PhosphorImager analysis of a Northern blot of ACB1 mRNA of Y700pGAL1ACB1 and Y700 cells. Lane 1, Y700pGAL1ACB1 grown in galactose; lane 2, Y700pGAL1ACB1 grown in glucose; lane 3, Y700 grown in galactose; lane 4, Y700 grown in glucose. The y-axis is in arbitrary PhosphorImager units × 10−5. For experimental details, see MATERIALS AND METHODS

