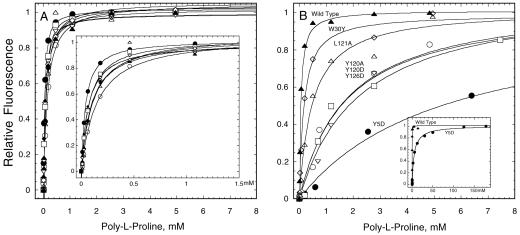
Figure 4.
Binding of profilins to poly-l-proline measured by intrinsic fluorescence. The dependence of the fluorescence changes on profilin concentration is fit with binding isotherms to measure the equilibrium constant. (A) Wild-type (▴) and actin binding mutants Y79R (○), K81E (♦), K81Y (▿), P107W (▵), P107Y (⋄), A111E (□), and minimally stable mutant C89S (●). Inset: Curve fits at low concentrations of poly-l-proline. (B) Wild-type profilin (▴) and poly-l-proline binding mutants W30Y (⋄), L121A (▵), Y120A (□), Y120D (○), Y126D (▿), and Y5D (●). Inset: Curve fit for wild-type and Y5D over a much larger range of poly-l-proline (150 mM).

