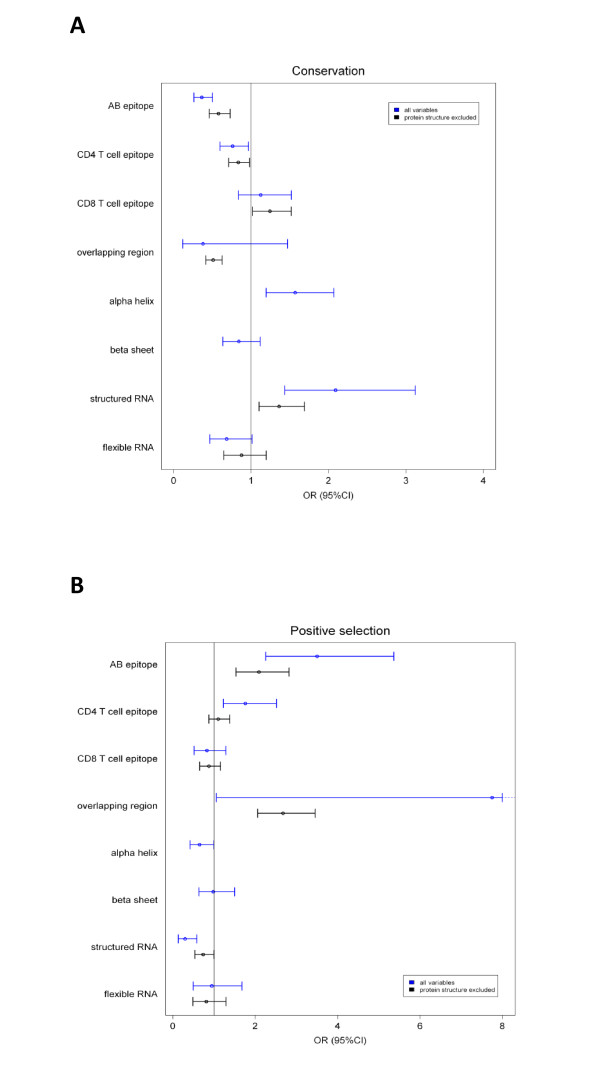
Figure 2.
Multivariate analysis of constraining and diversifying forces shaping the viral genome. For each variable, the odds ratio and 95% confidence interval are shown for a multivariate model predicting conservation (A) or positive selection (B). The vertical line shows the null hypothesis (OR = 1). Two separate analyses were performed, one including all variables (blue) and one excluding protein structure, not available for 45% of the genome (black). OR = odds ratio, CI = confidence interval.

