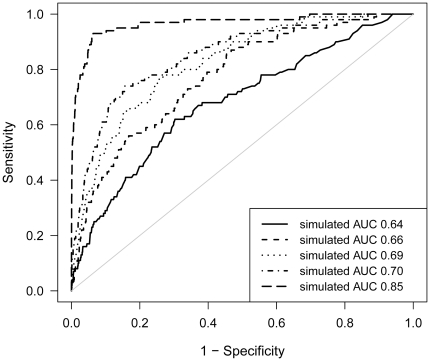
Figure 2. ROC curves for simulation models predicting MS. Four situations are depicted.
Solid line (____) represents ROC curve for simulation model based on 6 genotyped SNPs (AUC 0.64). Dashed line (----) ROC curve for simulation model based on 24 well replicated SNPs (AUC 0.66). Dotted line (……..) ROC curve for simulation model based on a total of 53 replicated and novel SNPs (AUC 0.69). Dash-dotted line (_ . _ .) ROC curve for simulation model based on 20 extra variants with an arbitrarily set allele frequency of 0.30 and OR 1.1 (AUC 0.70). Long- dashed line (__ - __) ROC curve for simulation model based on 50 extra variants with an arbitrarily set allele frequency of 0.30 and OR 1.4 (AUC 0.85).

