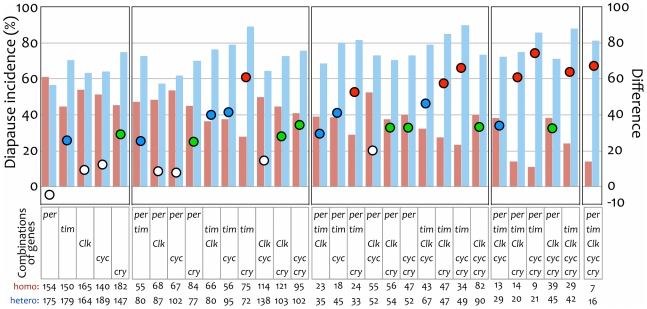
Figure 3. Diapause incidences for each genotype of BC progeny of Drosophila triauraria under short daylength conditions, and their differences between heterozygous and homozygous females.
Red and blue bars show diapause incidences (%) of flies homozygous and heterozygous for the genes shown as “Combinations of genes” in the middle of the figure, respectively. Numbers of dissected flies are shown at the bottom of the figure for homozygous and heterozygous, respectively. Plotted circles show differences in diapause incidences between heterozygous and homozygous flies of each gene set. The differences indicate the strength of the genetic effects of each gene set on the phenotype: a gene set with a strong genetic effect will show a higher difference. Blue, differences involving tim; green, differences involving cry; red, differences involving both tim and cry; white, differences involving neither tim nor cry. Scale for diapause incidence is shown on the left side, and that for difference is on the right side.

