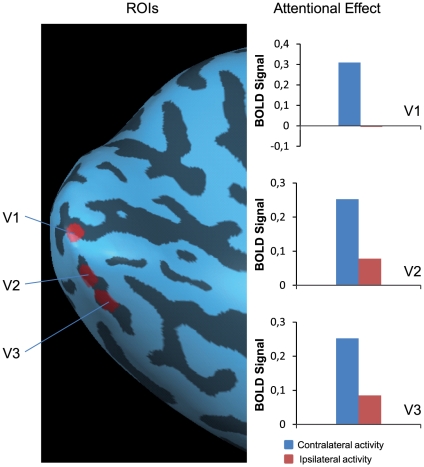
Figure 2. Example of mapped regions-of-interest (ROIs) and the attentional effect obtained at these ROIs.
Example of ROIs mapped onto the inflated left hemisphere of a typical subject. Bar graphs represent the attentional effect (contra-lateral (blue) activity versus ipsilateral (red) activity) obtained at these ROIs. For each participant and each hemisphere ROIs were mapped in this manner and time courses were obtained at these individually mapped ROIs.

