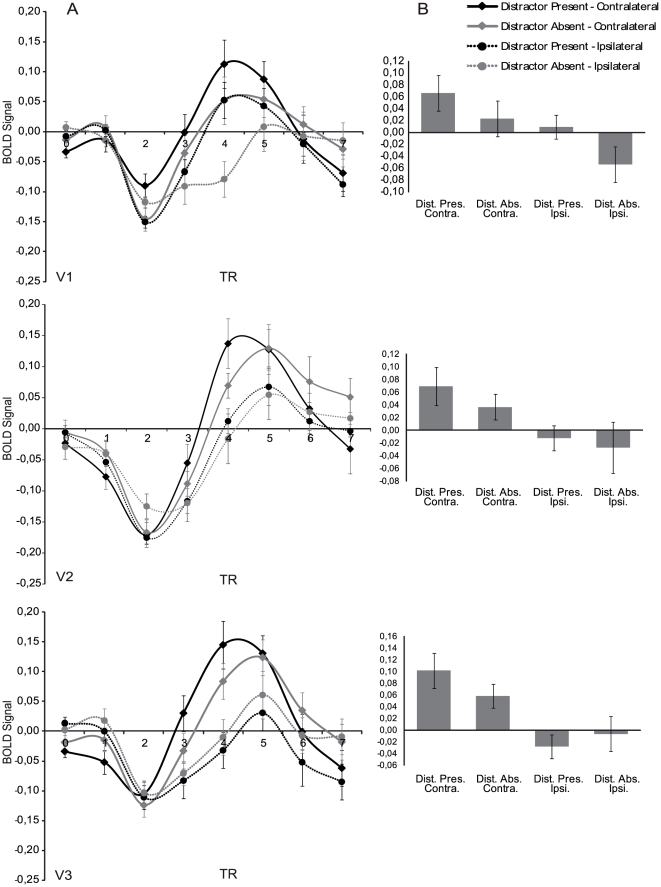
Figure 3. Obtained time courses and averaged BOLD signal.
A) Deconvolved time courses of the four trial types measured from cue onset. B) Average signal calculated over the peak of the BOLD response (TR3 – TR5; 1 TR = 1.8 s). Regions of visual cortex contralateral to the cued visual hemifield showed larger responses compared to ipsilateral regions in all ROIs during this interval. There was no main effect of distractor expectation, but in V3, an interaction between laterality and distractor expectation was observed for this interval, showing that preparation for a distractor had the largest effect at contralateral sites. Error-bars reflect standard-error corrected for the use of a within-subjects design.

