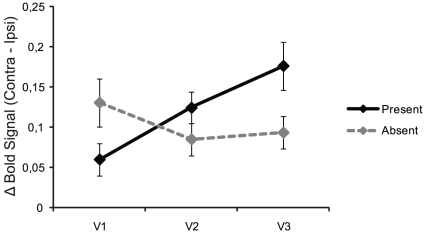
Figure 4. Effects of attention (contralateral – ipsilateral BOLD responses) for distractor present and absent trials.
The data points reflect averaged BOLD responses over the two hemispheres for TR = 4, reflecting the peak of the BOLD signal. When distractors were expected, the effect of attention differs in the early visual areas, increasing linearly over higher visual areas (black line). This effect was not observed when distractors were not expected (gray line). Error-bars reflect standard-error corrected for the use of a within-subjects design.

