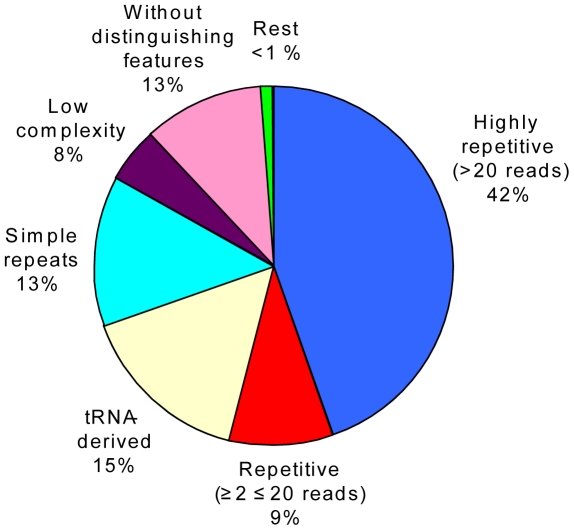
Figure 3. Distribution of features of A. ostenfeldii genomic sequences illustrated with combined BAC and fosmid data.
“Rest” includes genes (16), viral sequence, SINE, LINE, LTR retrotransposons, DNA transposons, RNA pseudogenes (snRNA, scRNA, rRNA), and satellites. Repetitive sequences were identified by contig generation within each library and BLASTn between the two libraries. Transposons were identified as described in the text. The remaining features were determined by RepeatMasker analysis. The category “Without distinguishing features” includes all single reads with no BLAST or RepeatMasker hit.

