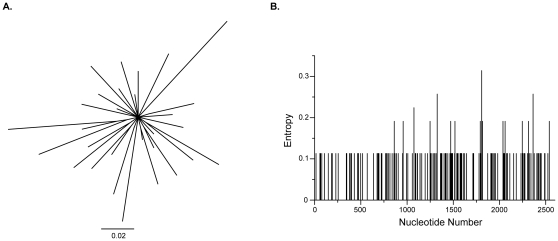
Figure 1. The diversity of the infecting SHIV-162P3 inoculum.
(A) A maximum likelihood tree constructed with 42 independent full-length clones isolated from the infecting SHIV-162P3 inoculum. An unrooted tree layout is displayed. The horizontal scale bar represents genetic distance. (B) Entropy plot of inoculum diversity as a function of nucleotide position.

