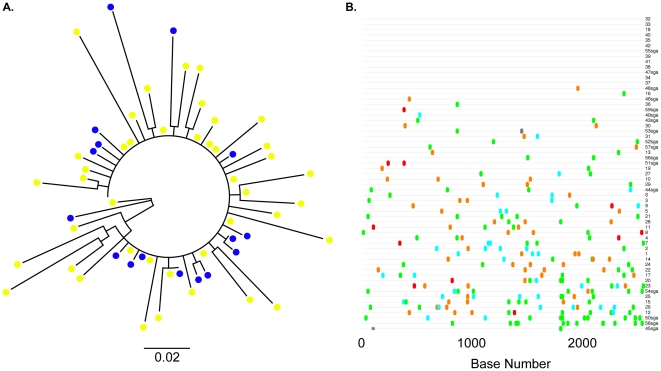
Figure 2. The relationship between SHIV-162P3 stock full-length env obtained by standard cloning and single genome amplification.
(A) An unrooted maximum likelihood tree constructed with standard clones and 17 previously reported sequences generated by single genome amplification. Blue circles, SGA clones; Yellow circles; standard clones. The horizontal bar represents genetic distance. (B) Highlighter plot indicates the gp160 nucleotide variation between clones. Clones are numbered sequentially; SGA clones are depicted with “sga” after the clone number. Adenine, green; Cytosine, aqua; Thymine, red; Guanine, orange. Grey bars indicate missing sequence.

