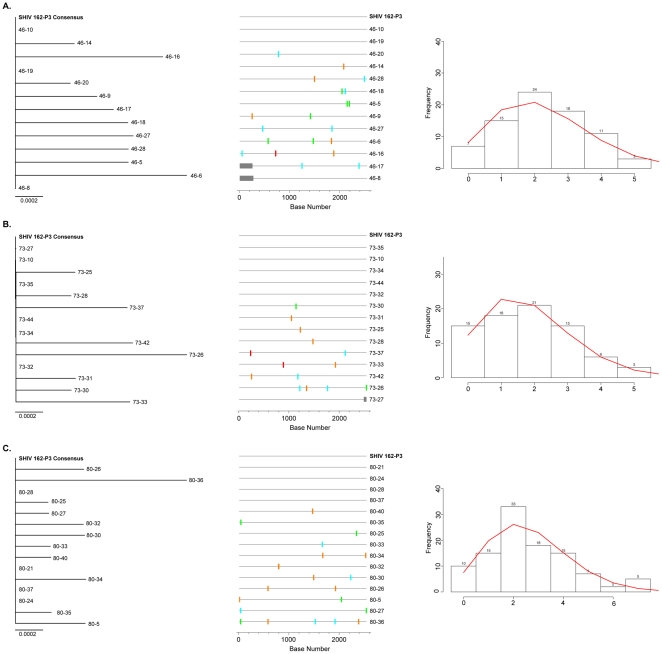
Figure 5. Neighbor-joining trees, Highlighter plots, and Hamming Distance frequency plots for independent T1 env clones.
(A) Mac46, (B) Mac73, (C) Mac80. Only near full-length sequences were used to construct NJ trees; fewer sequences are included than in Figure 1. Highlighter plots indicate nucleotide variation from the consensus; a base mixture at a given position in the consensus sequence is indicated as a variation in the highlighter plot, even if that base is present in the consensus mixture. The horizontal scale bars represent genetic distance. Adenine, green; Cytosine, aqua; Thymine, red; Guanine, orange. Grey bars indicate missing sequence. Hamming Distance (HD) analyses removed APOBEC-modified positions from all sequences; theoretical pairwise HD frequency counts are shown as a continuous red line. Numbers above histogram columns denote the frequency observed for each HD.

