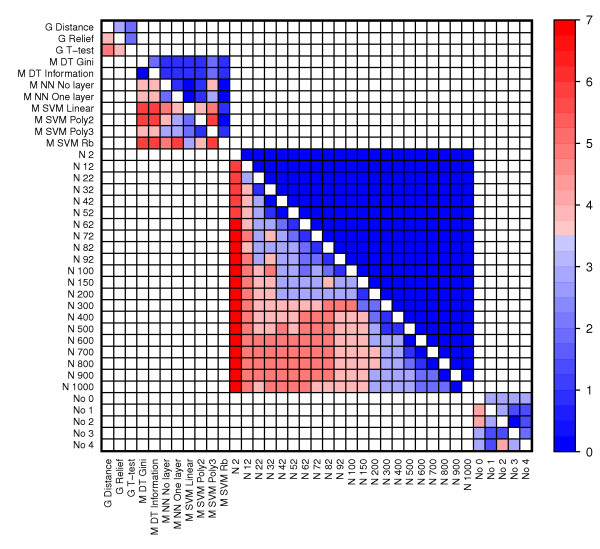
Figure 7.
The predictive performance of individual methods across data sets. The heatmap visualize the number of data sets in which one method (row) performed significantly better than another method (column). The Wilcoxon signed-rank test was used to compare the error rates of all combinations containing one method against the error rates of all combinations containing the other method. Significance was determined using a Bonferroni corrected p-value threshold (i.e. 0.05 divided by the number of tests).

