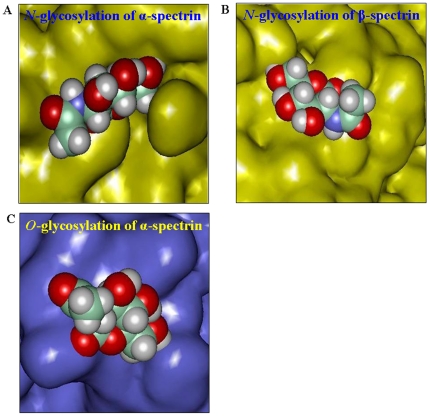
Figure 7. Space filling structural representation of GlcNAc in spectrinN.
Sugar moiety are colored by atoms (C = green, O = red, N = blue and H = white). The protein model is represented as conolly surface. A. N- glycosylation of α-spectrin is shown in yellow color at position Asn-1625. B. N- glycosylation of β-spectrin is shown in yellow color at position Asn-194. C. O- glycosylation of α-spectrin is shown in blue color at position Thr-817.

