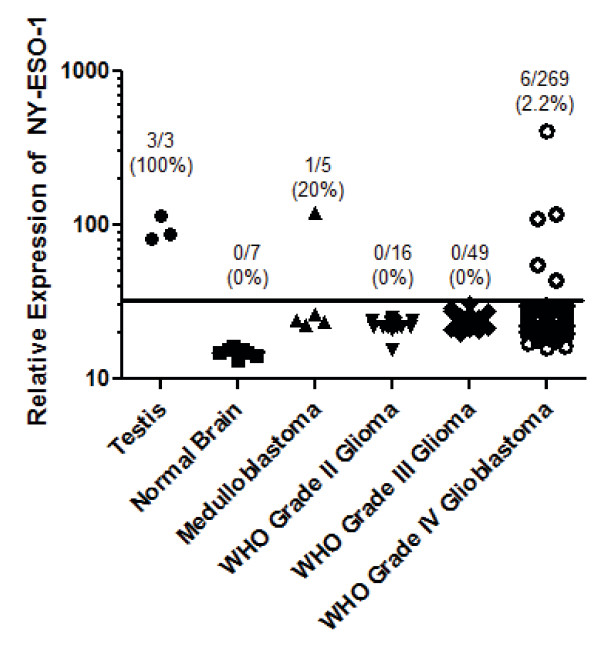
Figure 3.
Expression of NY-ESO-1 in human brain tumor tissues. A large panel of normal tissues and brain tumors of varying grades were subjected to global gene expression profiling using Affymetrix U133 2.0 chips. The relative expression of NY-ESO-1 was normalized and tested. Dots plotted underneath the black line are considered to have background relative expression levels.

