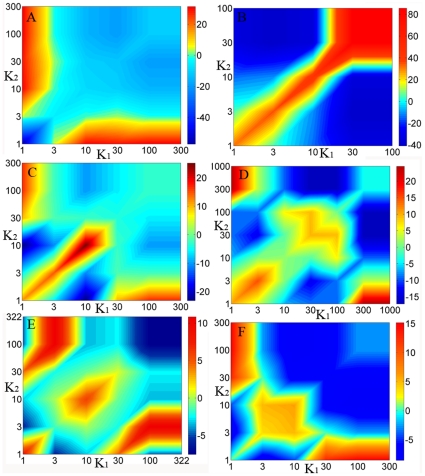
Figure 2. Correlation profiles of complex networks.
A. The plot of Z-score of Internet at AS level which is known to be disassortative, where the red color reflects the affinity of nodes and blue color reflects the repulsion between nodes. B. The profile of a social network constructed by collaborations between authors who co-authored a paper, which is known to be assortative. C. The correlation profile of yeast PIN constructed by HC dataset. D. The correlation profile of yeast GIN. E. The profile of yeast metabolic network abstracted from KEGG. F. The correlation profile of HC dataset after removing interactions between proteins within the same complex. Note that through C to F, at least 99% nodes of biological networks are localized in the lower left corner where the diagonal is colored red.

