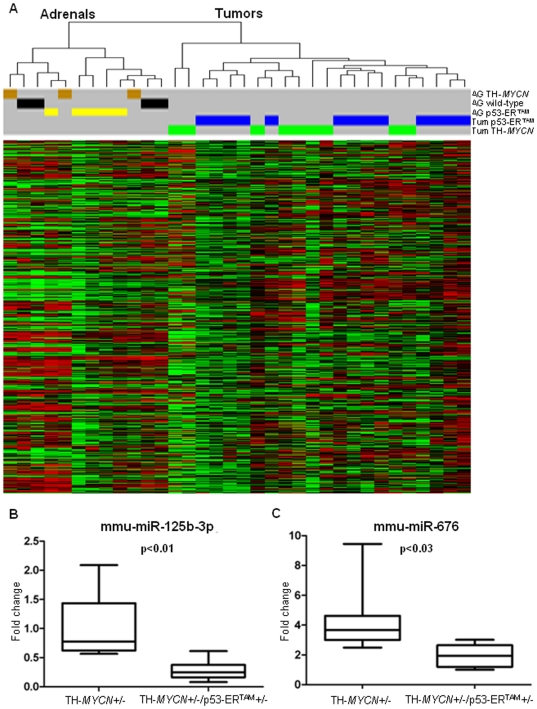
Figure 1. Hierarchical cluster and expression analysis of mouse tumors.
(A) Hierarchical clustering (n = 440) of mouse samples. Cluster “Adrenals” contains all the adrenals, while all the tumors samples fall into the cluster “Tumors” The overall miRNAs profile did not resolve the TH-MYCN (green) and TH-MYCN/p53ERTAM (blue) tumors, or the adrenals derived from wild type (black), TH-MYCN (brown) and TH-MYCN/p53ERTAM (yellow). (B)–(C). Expression of miR-125b-3p and miR-676 in TH-MYCN (n = 9) and TH-MYCN/p53ERTAM tumors (n = 13). The miRNAs are significantly down-regulated in the tumors lacking half of the active p53 protein, after Bonferroni multiple comparison correction (respectively p<0.01 and p<0.03).

