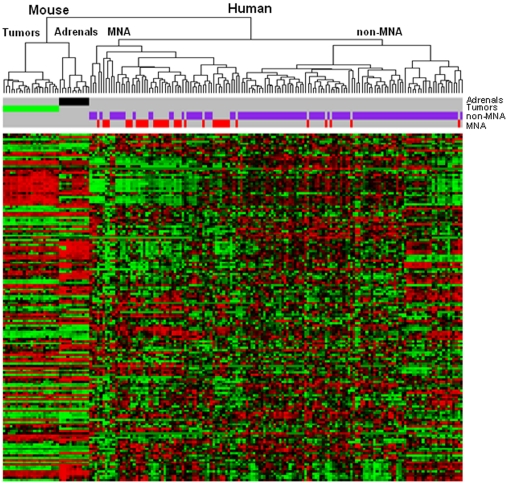
Figure 2. Overlapping of miRNAs deregulated in human and mouse tumors and hierarchical clustering on all miRNAs.
Hierarchical clustering based on the overall miRNAs conserved and present in both the studies (n = 155). Cluster “Mouse” contains all the murine samples split in two branches (“Tumors” and controls “Adrenals”). Cluster “Human” includes all the human tumors split (p<0.001) in a “MNA” and a “non-MNA” branch with an enrichment (52.5%) and an under-representation (5.7%) of MNA samples (red), respectively.

