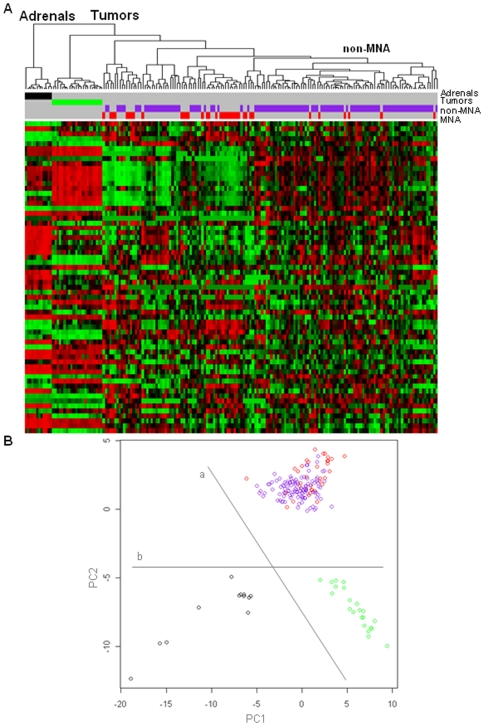
Figure 4. Analysis of human and mouse samples based on miRNAs (n = 63) deregulated in mice tumors.
A. Hierarchical clustering. Cluster “Adrenals” contains all the mouse adrenals. Cluster “Tumors” collects all the “Mouse” and “Human” tumors, highlighting a branch enriched (p<0.01) for human non-MNA samples (90.7%). B. Principal component analysis. Line “a” splits the samples based on the species: mouse (under) and human (above). Line “b” separates the samples according to the presence of the pathology: controls (left) and tumors (right). Mouse tumors (green), mouse adrenals (black), human MNA (red) and human non-MNA (purple).

