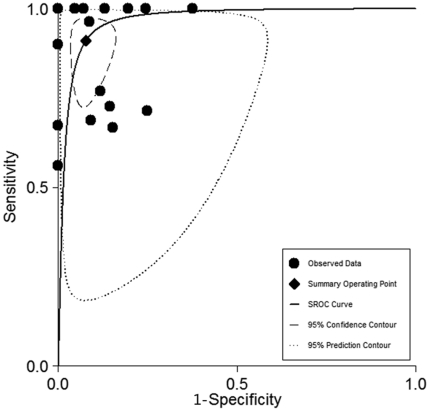
Figure 2. SROC curves from the bivariate model for proven and probable cases.
The region enclosed by the dashed line (confidence contour) contains likely combinations of the mean value of sensitivity and specificity. The region enclosed by the dotted line (prediction contour) demonstrates more uncertainty as to where the likely values of sensitivity and specificity might occur for individual studies. SROC, summary receiver operating characteristic.

