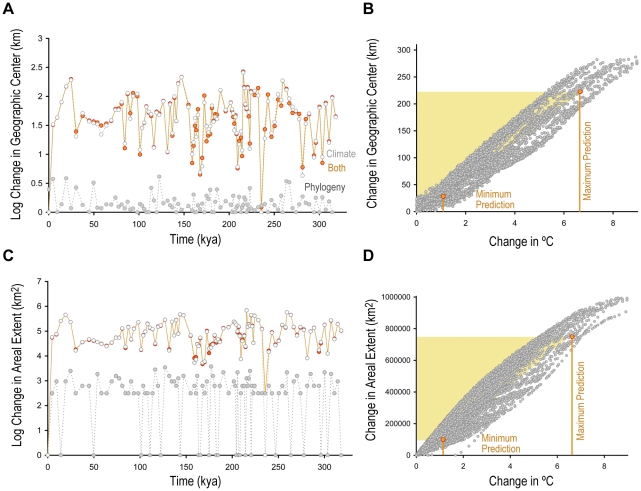
Figure 7. Average change in species' distributions of suitable habitat over the last 320 ky.
A, Time series of change in geographic center (km). Change due to climate and phylogeny are modeled separately to identify the contributions of each in a model incorporating change due to both climate and phylogeny. B, Change in geographic center as it relates to temperature (°C). C, Time series of change in areal extent (km2). D, Change in areal extent as it relates to temperature change (°C). The shaded area indicates increase in global temperature by the end of the 21st century predicted by IPCC 2007.

