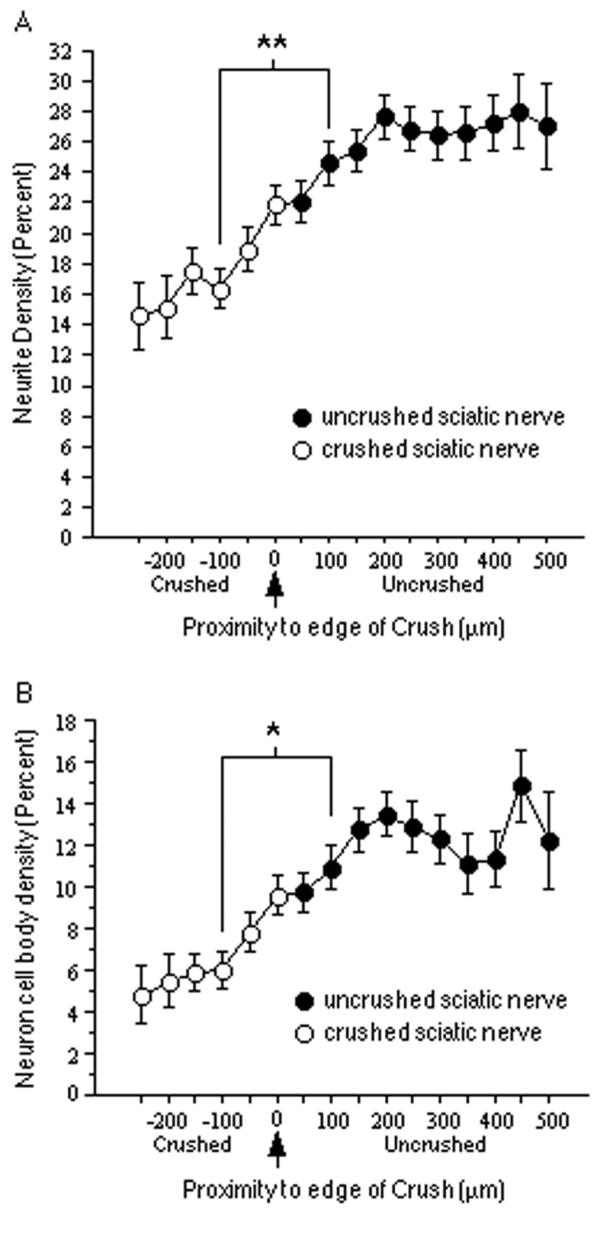
Figure 5.

Neuron and neurite density on crushed sciatic nerve. A, Neurite density on sections of crushed sciatic nerve as a function of proximity to the crush (the arrow indicates the edge of the crushed tissue; distances < 0 indicate crushed nerve; distances > 0 indicate uncrushed nerve). The y-axis is the percentage of the maximum number of neurites found in the same field. The mean neurite density observed at longitudinal positions 100 μm into the crushed portions of the nerve tissue was significantly less than that on uncrushed nerve tissue 100 μm from the crush edge. B, Neuron density on sections of crushed sciatic nerve as a function of proximity to the crush. The y-axis is the percentage of the maximum number of neurons found in the same field. The mean neuron density observed at longitudinal positions 100 μm into the crushed portions of the nerve tissue was significantly less than that on uncrushed nerve tissue 100 μm from the crush edge. All bars indicate mean + SEM (**p < 0.0001; *p < 0.001).
