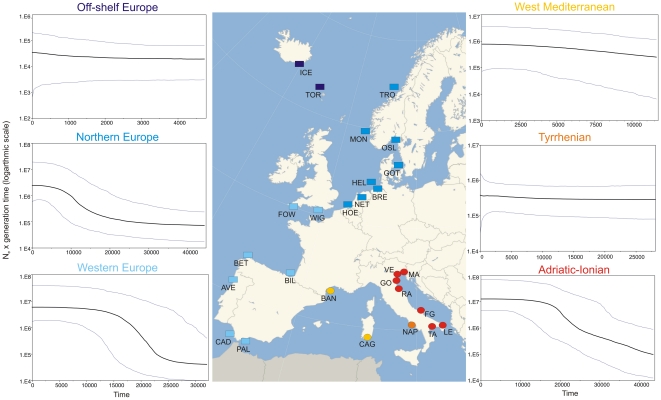
Figure 1. Distribution of collection sites and Bayesian skyline plot.
Sampling locations of Carcinus genus in Europe and demographic histories of all C. aestuarii and C. maenas groups using Bayesian skyline plots are shown. Reported are the plots of N e (effective population size multiplied per generation time) against time in years from present. Mean N e is shown as a solid black line and light blue lines enclose the 95% highest posterior density interval. Samples are labelled as in Table 1. The map shows the groups identified by AMOVA and MDS analyses for C. aestuarii (circles) and C. maenas (squares), coded in different colours.

