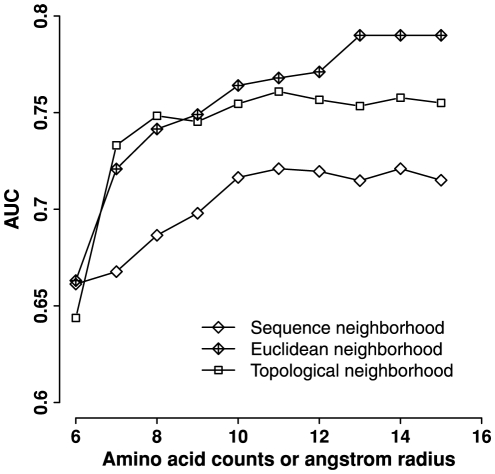
Figure 2. Neighborhood performance at different distance cutoffs.
The feature–residue counts by type in the neighborhood–was calculated for sequence, Euclidean, and topological neighborhoods at different distance cutoffs. A classifier was built by using each feature. The AUC value was calculated from a ten-fold cross-validation of the classifier. The x-axis represents the number of residues for the sequence neighborhood or the angstrom radius for the Euclidean and topological neighborhoods.

