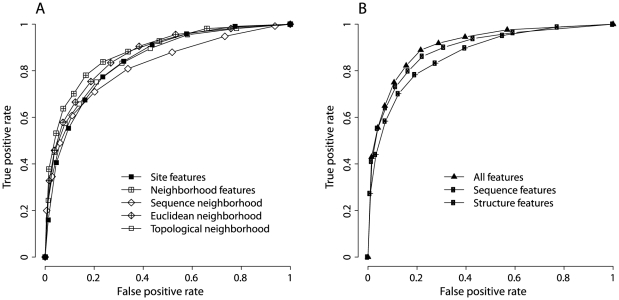
Figure 4. Performance of TS prediction models from a ten-fold cross-validation.
TS prediction models were built by applying logistic regression and Lasso regularized procedure. Different models used different sets of features. ROC curves were plotted to evaluate each model. A. TS prediction models using either mutation site features or neighborhood features. B. TS prediction models using all features, sequence features, or structure features.

