Figure 4.
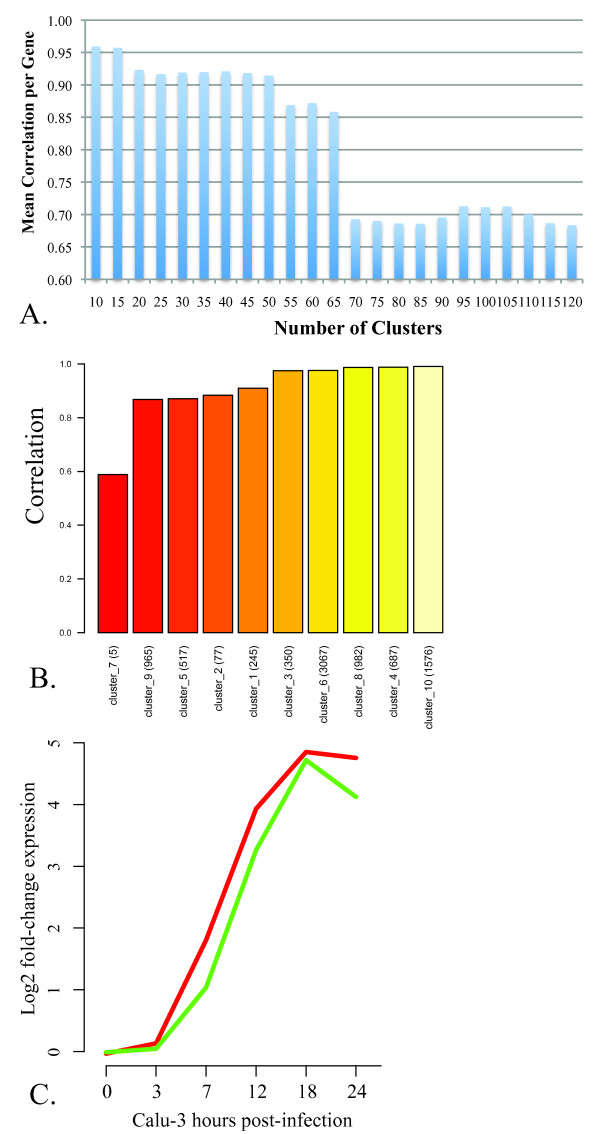
Performance of Calu-3 regulatory influence model in cross-validation. A. Performance of inferred models with varying numbers of target clusters. The cross-validation approach described was used to infer models based on varying numbers of target clusters (X axis) from the Calu-3 response to avian influenza infection. Performance is expressed as the mean correlation (Y axis) of predicted expression to the observed expression normalized to the number of genes in each target. B. Performance inferred model at predicting expression of co-expressed clusters. The cross-validation approach described was used to infer a model based on ten co-expressed clusters (X axis) from the Calu-3 response to avian influenza infection. Performance is expressed as the mean correlation (Y axis) of predicted expression to the observed expression for each cross-validated time point. Details about each cluster are provided in Table 2. C. Predicted and observed expression patterns for an innate immune-related cluster. The predicted expression levels (green line) from cross-validation are shown over the six time points post-infection versus the observed mean expression (red line) for cluster 8 (see Table 2).

