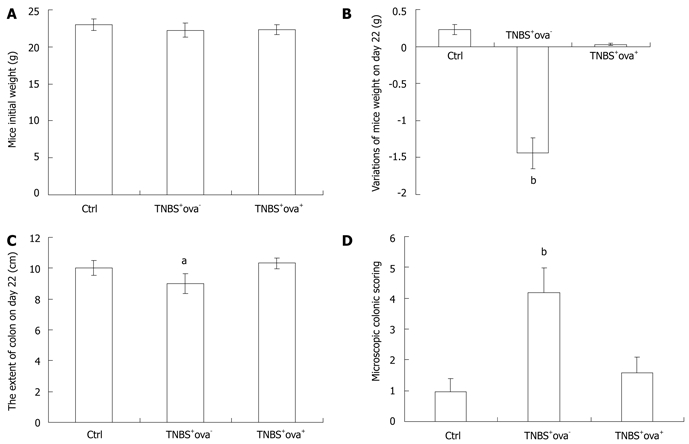
Figure 1.

The evaluations of colitis. The initial weight of each group (A) and variations of weight (B), colon extent (C) and microscopic colonic scoring (D) on day 22. Data are presented as mean ± SD. n = 10, aP < 0.05 vs the other two groups; bP < 0.01 vs the other two groups. TNBS: Trinitrobenzenesulfonic acid.
