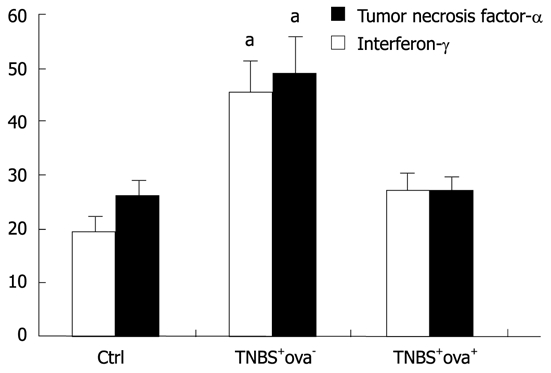
Figure 3.

The serum levels of tumor necrosis factor-α (white bar) and interferon-γ (black bar). Data are presented as mean ± SD. There were 20 animals in the control group and the TNBS+ova- group and 24 in the TNBS+ova+ group. aP < 0.05 vs the other two groups. TNBS: Trinitrobenzenesulfonic acid.
