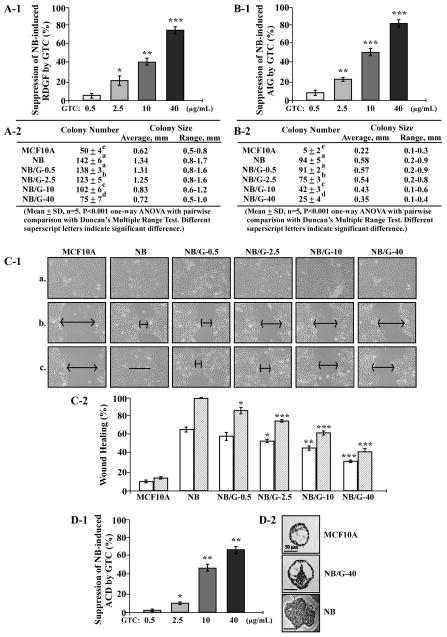
Figure 2.
GTC suppression of cellular carcinogenesis. MCF10A cells were exposed to NNK combined with B[a]P each at 100 pmol/L in the presence of GTC at 0, 0.5, 2.5, 10, and 40μg/mL for 10 cycles, resulting in NB, NB/G-0.5, NB/G-2.5, NB/G-10, and NB/G-40 cell lines, respectively. (A-1 and A-2) To detect suppression effectivity of GTC on cellular acquisition of reduced dependence on growth factors (RDGF), cells were then seeded and maintained in LM medium for 10 d. Cell colonies (≥ 0.5 mm diameter) were stained and counted. (B-1 and B-2) To detect suppression effectivity of GTC on cellular acquisition of anchorage-independent growth (AIG), cells were seeded in soft-agar for 20 d. Colonies (≥ 0.1 mm diameter) were counted. The percentage of suppression effectivity of GTC at various concentrations on NB-induced RDGF (A-1) and AIG (B-1) were calculated by: {1 [(# of NB/G-induced cell colonies) (# of MCF10A cell colonies)] ÷ [(# of NB-induced cell colonies) (# of MCF10A cell colonies)]} × 100. Columns, mean of triplicates; bars, SD. The Student t test was used to compare the control with each treatment to analyze statistical significance and P values adjusted for multiple comparisons using the Simes method, indicated by * P < 0.05, ** P < 0.01, *** P < 0.001. (A-2 and B-2) colony numbers, average colony size, and range of colony size were determined in A-1 and B-1, respectively. Mean colony numbers in each treatment were analyzed by one-way ANOVA at P < 0.01 to indicate significant difference in number of colonies in various treatments. To further determine significant difference between individual treatments, a pairwise analysis of variables was performed using the Duncan multiple range test. Significant differences at P < 0.01 between treatments are labeled with different superscript letters (a, b, c, d, and e); treatments labeled with the same superscript letters indicate no significant difference. (C-1 and C-2) To detect suppression effectivity of GTC on cellular acquisition of increased cell mobility, cells were seeded in CM medium and grown to confluence (a). A linear area of cell layer was removed from each culture with a 23-gauge needle to produce wounded cultures, and the wounded areas were examined (×100 magnification) 6 h (b) and 24 h (c) after wounding. Arrows indicate width of wounded areas. Results are representative of three independent experiments. (C-2) To calculate the wound healing area, the area not healed by the cells was subtracted from total area of initial wound to calculate the wound healing area at time intervals of 6 h (white columns) and 24 h (hatched columns). (D-1 and D-2) To detect suppression effectivity of GTC on cellular acquisition of acinar-conformation disruption (ACD), cells were seeded on Matrigel for 12 d. Regular and irregular spheroids in each Matrigel culture were counted; and then the percentage of irregular spheroids in each culture was calculated. The value of the suppression effectivity of GTC on carcinogen-induced formation of irregular spheroids was calculated by: {[(% of NB-induced irregular spheroid population) (% of NB/G-induced irregular spheroid population)] ÷ [(% of NB-induced irregular spheroid population) (% of irregular spheroid population in MCF10A cultures)]} × 100 (%). Columns, mean of triplicates; bars, SD. The Student t test was used to compare the control with each treatment to analyze statistical significance. P values were adjusted for multiple comparisons using the Simes method, indicated by * P < 0.05, ** P < 0.01, *** P < 0.001. All results are representative of three independent experiments. (D-2) Histological examination revealed acinar features of typical regular spheroids of MCF10A, regular spheroids of NB/G-40, and irregular spheroids of NB and NB/G-40 cells on Matrigel. Bars indicate 50 μm.

