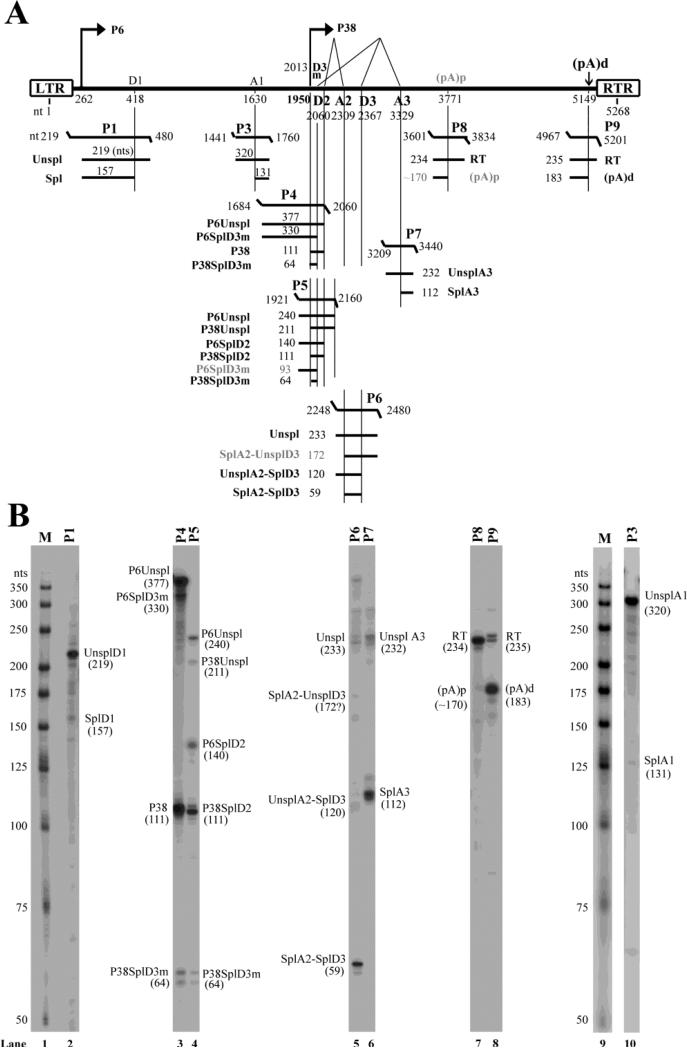
Figure 3. Transcription mapping by RNase protection assays (RPAs).
(A) Schematic diagram of the PARV4 genome and the probes used for the RPA. The PARV4 genome is depicted with the transcription units. Probes used for the RPAs are shown with their respective nucleotide numbers, together with the bands that they are expected to protect and the predicted sizes. Spl, spliced mRNAs; Unspl, unspliced mRNAs; RT, mRNAs read through the polyadenylation site. (B) Mapping of the PARV4 transcripts by RPA. Ten μg of total RNA was isolated from 293 cells transfected with p5TRPARV4, pAV5Rep78, and pHelper, and were protected by PARV4 probes P1 and P3-9. Lanes 1&9, 32P-labeled RNA markers with sizes indicated. Bands detected are designated in each lane.

