
Figure 2.
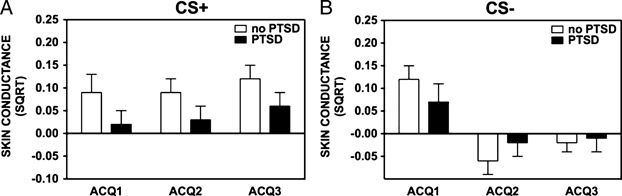
Skin conductance response between PTSD and controls by fear acquisition block, separated by trial type. (A) shows group differences in fear-potentiated startle across blocks during the CS+; (B) shows the group differences during the CS−. The value on the Y axis depict square root transformations of the SCR calculated at the level of electrodermal activity during the 3–6 s post-CS onset minus the electrodermal activity during the 1 s before CS onset.