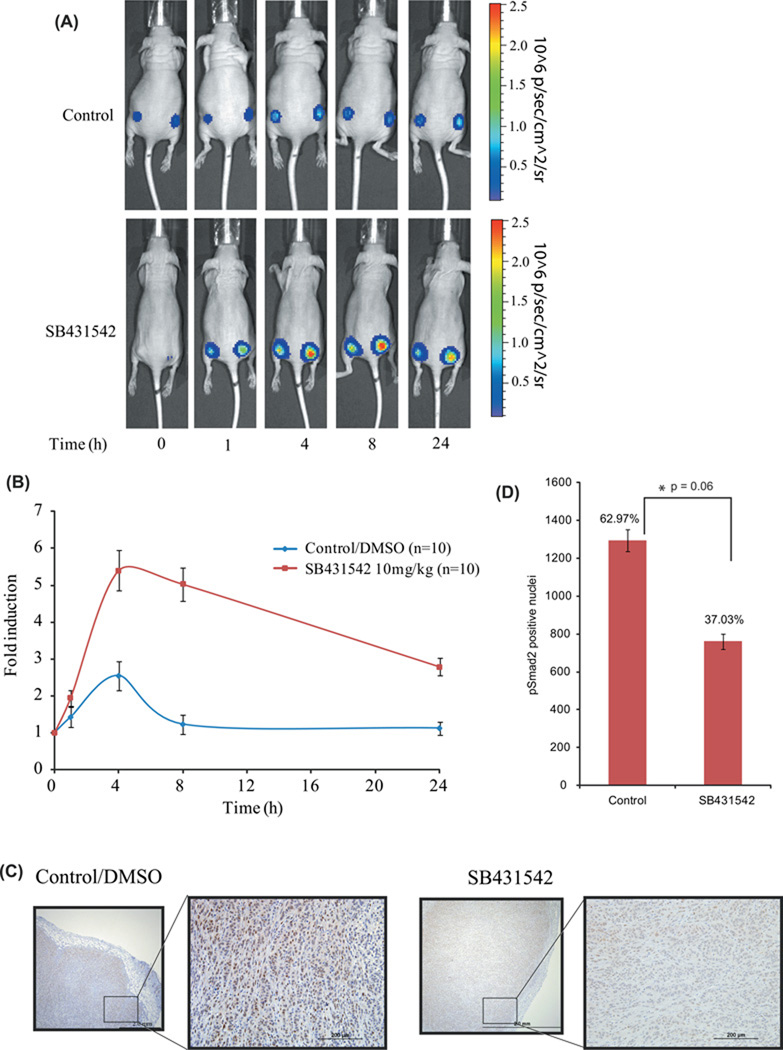
Figure 3. Molecular imaging of TGFβ signaling in vivo.
(A) Tumor xenografts expressing BTR-WT were established on each flank of four to six week old female athymic CD-1 nu/nu mice. Images of in vivo BTR reporter activity are shown following intraperitoneal injection of SB431542 (10mg/kg body weight) or vehicle control (DMSO) at 1, 4, 8, and 24 h. (B) Bioluminescence activity in tumor-bearing mice before treatment and in response to treatment were measured and expressed as fold induction. Values represent the mean ± SEM.
(C) Tumor xenografts were sectioned 4h post-treatment with SB431542 (10mg/kg body weight) or vehicle control (DMSO) and immunohistochemical analysis was performed using pSmad2(S465–S467) specific antibody. The scale bar is 2 mm and a10-fold magnification of selected section. (D) Quantification of number of cells staining positive for nuclear pSmad2 for control (n=3) and SB431542 treated (n=3) tumors in three random fields. A decrease in pSmad2 stained nuclei in SB431542 treated tumors (761 nuclei, 37.03%) was observed when compared to DMSO treated tumors (1294 nuclei, 62.97%). Statistical analysis: *p= 0.06 calculated by a two-sided Student’s t-test.

