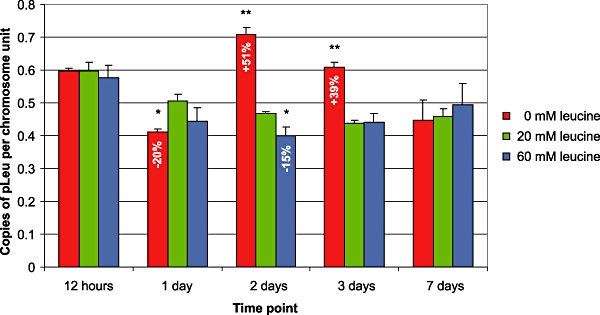
Fig. 4.

B. aphidicola pLeu plasmid copy number calculation in response to variations of leucine concentration in the aphid diet. For each time point (from 12 h to 7 days) the pLeu copy number per chromosome unit (means ± SE, n = 9) measured for the depleted (0 mM leucine) and for the excess condition (60 mM leucine) is compared with the values obtained on the reference diet (20 mM leucine) using a Dunett's test. Statistically different values are marked with ‘**’ or ‘*’, indicating a 99% or a 95% confidence level respectively. For each significant response, the percentage of variation relative to the control diet is indicated.
