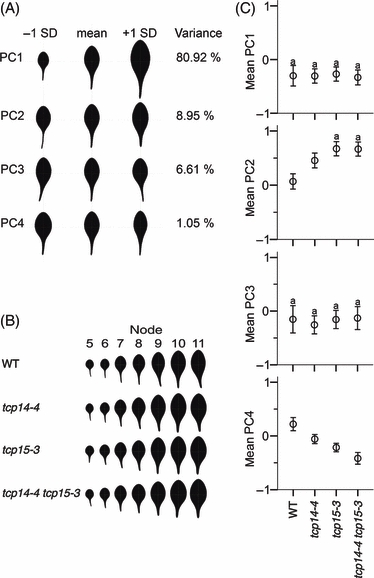
Figure 4.

Analysis of leaf size and shape in WT, tcp14-4, tcp15-3 and tcp14-4 tcp15-3 plants.
(A) Leaf size and shape according to variation along the first four PCs for the Arabidopsis leaf-point model of 1500 leaves. The mean leaf is shown, together with leaves for 1 SD either side of the mean leaf for each PC. The variance for each PC is indicated as a percentage. Together, the four PCs represent 97.53% of the total variation in leaf shape and size within the sample.
(B) Leaf point models for leaves in node positions 5–11 calculated from mean PC1, PC2, PC3 and PC4 values for each leaf for WT, tcp14-4, tcp15-3 and tcp14-4 tcp15-3 plants, representing the mean size and shape of the leaves for each line.
(C) Mean PC scores for all leaves from nodes 5–11 for WT, tcp14-4, tcp15-3 and tcp14-4 tcp15-3. Error bars represent 95% confidence intervals. The letter ‘a’ indicates that there is no significant difference between genotypes.
