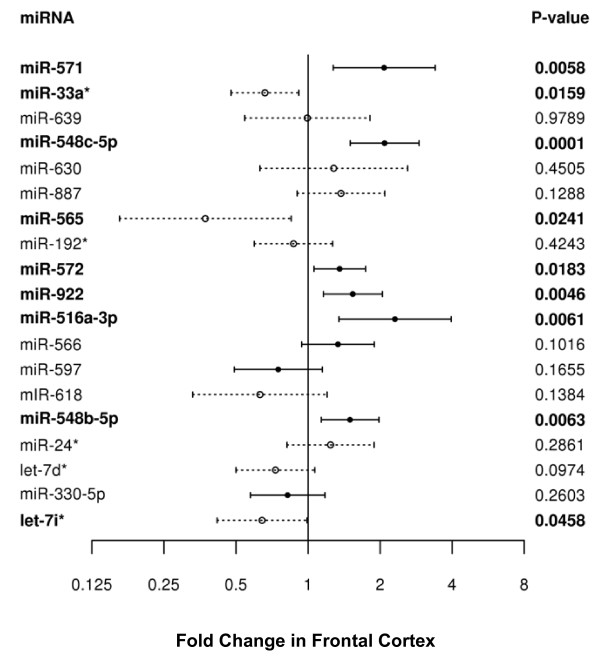
Figure 2.
Validation of miRNA candidates in frontal cortex of FTLD patients. For each miRNA, fold change of PGRN+ FTLD-TDP patients compared to PGRN- FTLD-TDP patients with 95% confidence intervals are shown with their associated p-value. Significantly dysregulated miRNAs are shown in bold. Solid bars represent miRNAs which were upregulated in the original miRNA array, dashed bars represent miRNAs downregulated in the original miRNA array.

