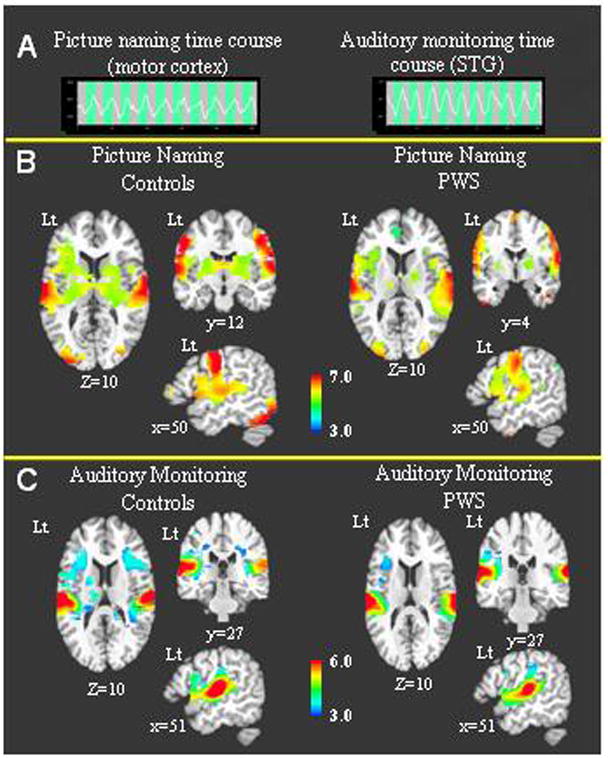
Figure 1.

1A – BOLD signal time courses from single voxels are shown for a control participant. The first time course is from the oral motor cortex during the picture naming task and the second is from the superior temporal gyrus during the auditory monitoring task. 1B –The average BOLD activity during the picture naming task is shown for each group. 1C - The average BOLD activity during the auditory monitoring task is shown for each group.
